In 2013, the Association of Australian Dial Before You Dig Services (DBYD) introduced a national damage reporting tool for its members. The purpose of the tool is to capture and collate data relating to damage to its members’ assets, build a comprehensive picture in relation to these incidents and the associated impact, and provide insights to reduce future damages.

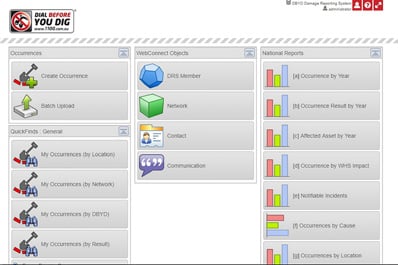
IDRS WebConnect – Main Page
DBYD partnered with Mipela GeoSolutions to deploy an intuitive, easy to use, web-based data capture tool that provides comprehensive reporting and spatial representation of data. The Infrastructure Damage Reporting System (IDRS) allows data to be collected and stored in a convenient repository for analysis and reporting by DBYD members within their organizations. Organizational data can also be compared with industry data on a national level.
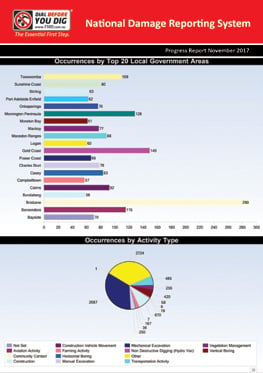
The data is hosted in a secure cloud-based environment within Australia, and the reporting functionality has been comprehensively utilized to produce a variety of scheduled and on-demand reports. Individual members can also engage with DBYD to have additional customized report templates prepared on their behalf.
Today, the IDRS is used to collate and report on both underground and aboveground asset incidents and enables users to analize the cause of these incidents. DBYD and its members can use these results to drive improvements in their operations and develop programs that will help avoid future incidents.
The IDRS enables asset damage data to be viewed within a broader context (e.g. individual incidents can be evaluated within trends over time and wider regional views), resulting in more meaningful insights and conclusions. Not only has the IDRS aided in the understanding of what’s happening to assets, it has been a valuable tool for utilities and asset owners in their damage reduction activities, including:
• Highlighting specific areas for damage prevention stakeholders to focus their limited resources to achieve the greatest results
• Awareness sessions, education and training targeted to specific groups
• Increasing requests for location services by local contractors and excavators
• Improving the identification of underground assets among locating professionals through best practices in education and training
• Improving safe excavation practices
“DBYD has made a commitment to this reporting tool and we look forward to more members benefitting from this technology. We believe that the IDRS will assist with the reduction of infrastructure damage and improved safety in our industry,” said DBYD’s SA/NT State Manager, Nigel March.
Any damage to an infrastructure service provider’s asset has an impact on the community whether it is power, gas, telecommunications, water, etc. Damages have economical and potential environmental impacts for all concerned. Preventing one incident from occurring can, in many situations, prevent injury or fatal outcomes.
As the data volumes and history increase over time, the benefits to the community and the economy through fewer disruptions to vital services will continue to grow. Being able to quantify the impact of asset damage incidents through the data, and finding ways to reduce these disruptions, is the true value of this tool to the Australian economy.
Case Studies :
Energy Queensland (DBYD Queensland Member)
Ergon Energy (now combined with Energex to become Energy Queensland) saw the opportunity in 2014 to capture not only underground asset damage incident data, but also aboveground assets incident data. At that time, Ergon Energy was responsible for delivering power to 97% of the Queensland state and had a wide-ranging network that consisted of more than one million poles, approximately 160,000 kms of overhead conductor and 7,000 kms of underground network. Having such a large volume of aboveground infrastructure that is more likely to come into contact with third parties means these assets are involved in a far higher rate of contacts, more regularly than buried assets.
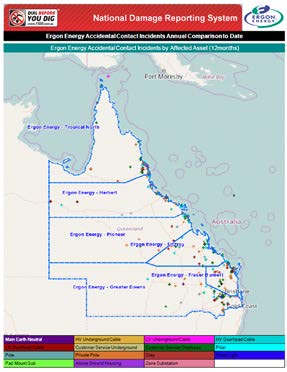
To date, Energy Queensland has uploaded 10 years of asset damage data into the IDRS and continues to provide ongoing monthly updates. Additional customized monthly reports are used to identify areas of high damage activity, trends by industry, asset type and region. Energy Queensland can also produce statistical and spatial reports on business-related metrics such as:
• Restoral costs
• Total customers affected
• Man hours
• Customer downtime

In Energy Queensland’s case, they have refined their reporting requirements to align directly with their safety awareness strategies, allowing them to focus on key safety messages to the wider community around engagement, education and enablement.
Energy Queensland Community Safety Manager Aaron Smith provided the following endorsement, “The way that we can extract our incident data and the tailored automatic reports that get sent to us every month has been a huge benefit. We can get all the reporting data and break it down within minutes, a big time saving exercise. We are certainly seeing huge benefits for our business and a vastly improved level of reporting and incident analysis.”
It’s a tribute to the success of the tool that Energy Queensland has backdated their data seven years and continue to tell their story, promoting the value of the IDRS to their fellow DBYD members.

Ergon Energy Report Map
SA Water (DBYD South Australia member)
An opportunity was recognized during 2015 to utilize and develop the IDRS for SA Water use. The aim was to enable local data management and reporting, as well as national reporting with a focus on damages caused by SA Water construction and operational activities. In this case, the member was focused on the damages caused by their own internal and external workforce on other members’ assets during their Capital Delivery construction programs across the state.
SA Water saw the business benefits of using the IDRS as:
• Greater understanding of their corporate and stakeholder risk & contractors’ compliance.
• Consistency of data capture based around common occurrence, cause and consequence prompts.
• Data management is extended through reporting, (via mobile application), office-based reporting or validation via web browser interface and data verification with security levels for users.
• Data management process can allow for the front-end user (initiating constructor) to manage their own data sets and have automated (self) management reporting. Verification and consistent reporting (from common data sets) can extend through SA Water Corporation to National DBYD level within the same system.

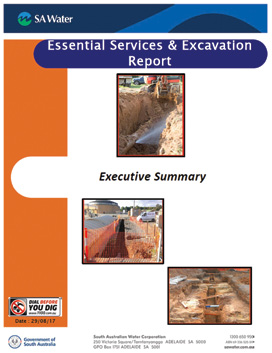
SA Water Report
Assistance with development and technical support through collaboration with DBYD.
The IDRS was rolled out to their prime contractors and internal workforce to use in real time field environments, using computer tablets that just require a browser connection to the IDRS WebConnect.
Additional data fields were created in the IDRS for SA Water’s reporting requirements and once enough data was captured, they then worked with DBYD and its vendor to produce statistical and spatial report charts which were then used by SA Water to produce a quarterly “Essential Services & Excavation Report.” This quarterly report is distributed to their management teams together with individual reports to their prime construction contractors, enabling new strategies to improve stakeholder engagement, education and enablement.
Bruce Coleman has spent the majority of his career in the Telecommunications industry across technical, customer access network planning, design and construction areas. He has spent the last seven years working for DBYD (National), supporting the national implementation and administration of the DBYD Infrastructure Damage Reporting System. He has also worked with DBYD SA/NT on Membership and Awareness Training. Bruce can be reached at bcoleman@1100.com.au.
Comments