In the Protecting our Infrastructure of Pipelines and Enhancing Safety (PIPES) Act of 2016, congress ordered the Pipeline and Hazardous Materials Safety Administration (PHMSA) to conduct a study on improving existing damage prevention programs through various potential technological improvements. In response, PHMSA collaborated with several industry groups, including the Common Ground Alliance (CGA), and delivered a final report in August 2017 (phmsa.dot.gov/sites/phmsa.dot.gov/files/docs/news/18351/reporttocongressonimprovingdamagepreventiontechnologyaug2017.pdf). The second recommendation in the report is to “Evaluate and implement predictive analytic tools, which use data to identify and proactively address high-risk excavations.”
A Predictive Analytics Engine
An Excavation Damage Risk engine does exactly that, and is allowing various stakeholders to achieve significant year-over-year reduction in total damages and damages per 1000 locate requests. It uses statistics gathered from historic locate requests and associated damage records to predict the probability of damage on new locate requests. It can also incorporate information about the specific underground facilities that are at risk. This allows the total risk score to also include the consequences of damage to specific facilities at a specific location. The underground facility information can either be provided by the ticket management system (if it already has knowledge of the facilities at risk), or by accessing the facility owner’s geographic information system via a secure web feature service.
The engine can also update the risk assessment using information gathered during the mark-out, such as who performed the locate (company and/or person) and whether any facilities were marked in the field (“cleared” or “marked”). This provides even better results to target post-locate risk mitigation activities.

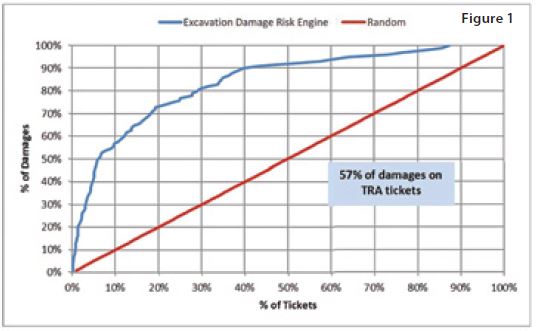
In multiple experiments, the engine can rank locate requests such that 50% or more of the damages will occur on the top 10% of locate requests (Figure 1). This presents an opportunity to focus damage prevention activities on a small sub-set of the active excavation sites, where the total risk (probability and consequences) is highest.
Damage Prevention at National Grid
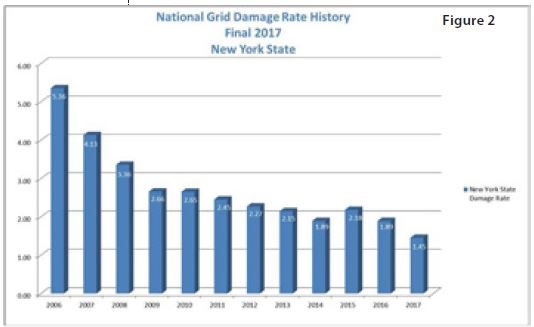
National Grid is an international energy company that operates regulated gas and electric distribution systems in several states, including New York. By implementing CGA Best Practices around Pipeline Public Awareness and 811 education, and improving locate and mark performance, the company made great improvements over the years and drove down damages per 1,000 tickets (Figure 2). However, along with the rest of the industry, the improvement began to level out starting in 2013 and it became clear that all the low hanging fruit had been plucked. At the same time, the New York State regulators began to require measurable improvements in damage rates for all gas utilities.
As a result, the company needed to be innovative in their approach to preventing excavation damages. Any further improvements would either require a significant increase in available damage prevention resources (a budgetary challenge), or much more effective use of the resources available.
In 2014, they partnered with a utility service to improve its existing damage prevention program. Together, they formed a team to focus on educating and monitoring known violators of excavation. The approach was to target excavators with a history of damages and deploy resources known as Damage Prevention (DP) Advisors to communicate with crews onsite prior to excavating on an 811 ticket.
The DP Advisors are the messengers, preaching Best Practices and identifying abnormal operating conditions. According to Vinny Marchese, VP, “We worked extremely hard to kick off the program. The effectiveness started with partnering in the training process. DP Advisors need a solid foundation of knowledge to educate others on state and federal excavation laws and best practices.”

Using Risk to Prevent Damages
As shown in Figure 2, the rate of damage to New York State facilities from 2013 through 2016 was flat (hovering around two damages per 1,000 locate requests). In 2017, there was significant reduction. What led to this result?
By 2016, we knew where the excavating community was going to be working because most of them were utilizing the 811 system. But now we needed to know more. We needed to predict where damages were going to occur BEFORE they happened. This led us to explore the use of predictive analytics, to help prioritize our daily damage prevention activities.
If we could use the predictive analysis software to accurately predict where we were at the highest risk for damage, we had an opportunity to utilize our Damage Prevention Inspectors and Advisor resources to get in front of that excavator, provide guidance, support and education, and explain why a specific 811 ticket was at a higher risk for their crew of damaging an underground gas facility than a different 811 ticket.
In late 2016, the risk assessment engine was deployed for use in all New York State service territories. The program was deployed and in use by early 2017, helping to prioritize the daily activities of the DP Advisors.

How Many Damages Were Prevented?
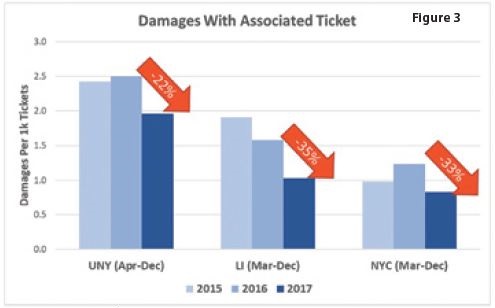
So far, results have been very encouraging. We feel certain that we’ve prevented hundreds of damages that were otherwise inevitable. As shown in Figure 3, since initiating use of the Excavation Damage Risk engine in each New York State region, significant year-over-year reductions in Damages per 1,000 locate requests were measured (counting only damages that occur after a proper One Call notification was made). Upstate New York decreased by 22%, while Long Island and New York City both decreased by more than 30% relative to the same time periods in 2016.
This reduction occurred despite a 17% increase in the total number of locate requests received during those time periods. If the damage rate in 2017 continued at the same levels as 2016 (1.65 damages per 1,000 tickets), expectation would have been 745 damages at sites where proper notification was made. Instead, only 510 damages were reported. In other words, 235 (32%) of the expected damages did not occur for some reason.
Of course, we can’t say for certain what changes prevented those damages from occurring. There may have been other legislative changes in New York State that contributed, increased public awareness because of recent incidents or enforcement proceedings, etc. To better target our assessment, we can focus specifically on the locate requests where additional risk mitigation activities were performed. Our goal is to take some additional action on approximately the top 10% of locate requests, as ranked by the engine.

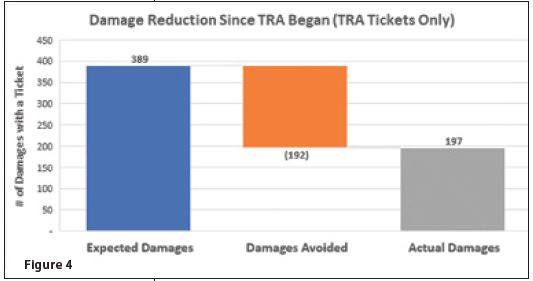
One approach is to assume that the engine continued to rank tickets just as effectively after we began targeting the top 10% of locate requests as it did in experimental results applied to locate requests from before that time. In back-testing, 49% of actual damages occurred on the top 10% of tickets as ranked by the engine. If the same overall rate of damage and engine effectiveness continued in 2017, the company would have experienced 389 damages on the top 45,010 locate requests during times when the utility service was performing additional field services (49% of the 745 expected damages). Instead, only 197 damages occurred on those locate requests. By this assessment, our use of the engine to prioritize damage prevention activities eliminated 192 (49%) of the expected damages on the top 10% of locate requests. This accounts for 82% (192/235) of the overall prevented damages (Figure 4).
Conclusions
While the systems and processes have been in place for less than year, all signs currently indicate that using a predictive risk model to target damage prevention activities can have a significant impact on overall damage rates. In addition, there are indications that even more damages can be prevented by finding the most effective risk mitigation activity to apply, or by investing sufficient resources to fully cover the top 10% of locate requests (or even more). These combined damage prevention solutions are being applied at several other large gas utilities, with similar results. National Grid, RECONN, and Opvantek will continue to monitor results over the coming year and we look forward to sharing our continued success with the industry.
Tony Sileo is Vice President, Sales & Product Management for Opvantek, Inc. He can be reached at tsileo@opvantek.com. Robert Terjesen is Manager, Damage Prevention for National Grid. He can be reached at Robert. Terjesen@nationalgrid.com. Ryan Martino is Regional Director for RECONN Utility Services (a division of USIC, LLC). He can be reached at RyanMartino@usicllc.com.
